Help
BindDB is an epigenetic database which includes a multitude of histone modification and factor binding data for the mouse and human embryonic cell types. The BindDB website allows you to query the database with and receive a comprehensive epigenetic profile of genes and genomic regions of interest to you. The data consists of hundreds of ChIP-seq and ChiP-on-chip datasets for numerous Trasncription Factors, Histone Modifications and other protiens. These experiments were either performed by the Meshorer lab, or collected from previous publications. The results are expressed in a table giving a "bird's eye view" of all the areas of interest in one placeCreating the query
There are two ways of using the tool to get results:- 1. Exploring a single gene or region
- 2. Exploring a list of genes/regions by uploading a file
IMPORTANT: Always select a species before entering your query!
Exploring a single area
This is the interface for exploring a single area: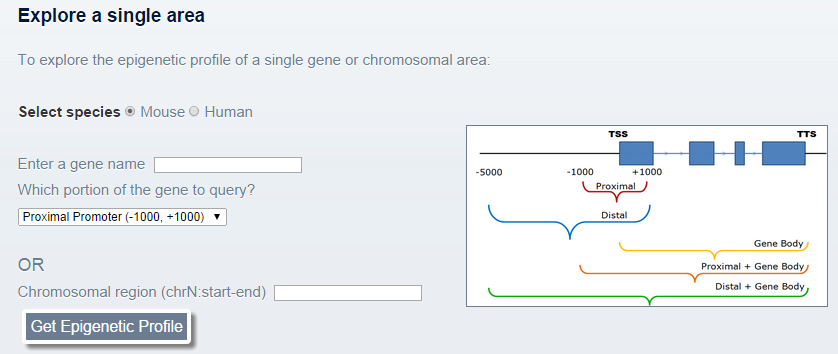 This section allows the user to query one gene or one location in the genome.
For a gene, the user can specify an Entrez gene symbol (e.g. Pou5f1), Refseq annotation (NM_XXXXX) or UCSC known gene annotation (ucXXXXX) as the gene name and also the portion of the gene to explore: The promoter (proximal/distal (-1000nt/-5000nt, +1000nt around the TSS), and/or the gene body. BindDB automatically resolves the gene name into a genomic location and extracts the designated promoter/body portion according to the user specification.
Alternatively, if a more specific region of the gene is desired or the region is not a gene at all, a genomic location in the form of "chrN:start-end" can be designated in the appropriate field, where N is the chromosome number and 'start' and 'end' are the start and end coordinates, respectively. (Tab delimited fields work as well).
Once the data is entered the query may be submited via the "Get Epigenetic Profile" button
Exploring a list of genes / chromosomal areas
This is the interface for uploading a file in order to explore a list of areas: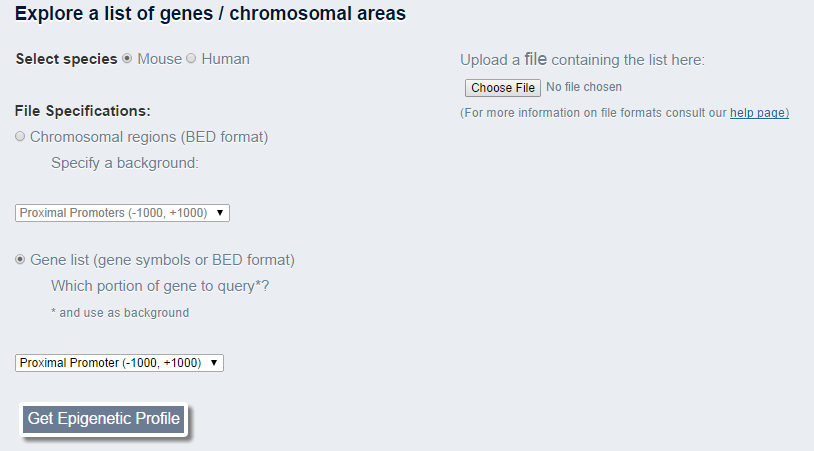
- ** Press the "Choose File" button, and locate the file on your computer, then press "Open" in order to select the file
BindDB accepts BED4, BED6 or BED12 file formats.
The file should be tab delimited where each row represents a different gene/region.
The format for each row for BED6 is:
chrX [tab] start position [tab] end position [tab] gene name/description [tab] score [tab] strand
NOTE! Gene/region names must be unique!
NOTE! Overlapping genes or regions will be merged by BindDB.
NOTE! Strand information (BED6 or higher) is required in order to treat regions in the file as genes and extract promoters, bodies, etc...
NOTE! Make sure chromosome numbers are valid and do not contain "random" or "undefined" chromosomes. Ensure that coordinates are within chromosomal limits.
NOTE! The file should be formated correctly otherwise the query will fail - ** Specify how you want BindDB to treat your file either as a list of chromosomal regions ("as-is") or a list of genes. For the first type, the exact regions in the file will constitute the query. You must inform BindDB which background you would like it to use for statistical calculations (enrichment scores and pvalues), in other words, which portions of the genome to compare your regions with. These can be all gene promoters (proximal or distal), and/or gene bodies. You may also choose to compare to the entire genome, but be aware of the discrepancy between the size of your query and the size of the genome which may lead to skewed statistical calculations! If you select the second option, BindDB will treat your regions as genes and extract the portion of the gene that you designate in the drop-down dialog box below. Strand information (BED6) is required for this option.
- ** After selecting the file upload it and perform the query by pressing the "Get Epigenetic Profile" button should be pressed.
The results
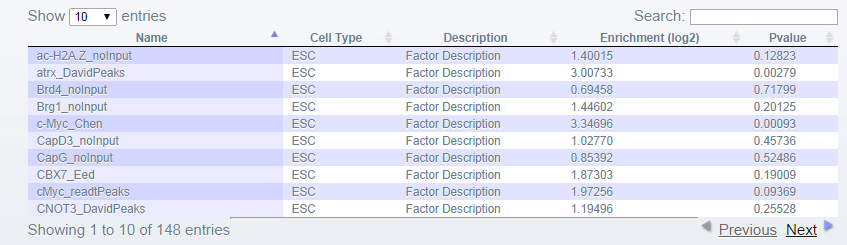
The results are presented in several ways:- 1. Positive Results Table Each line of the table represents a factor in the BindDB database with a peak overlapping one or more of the queried region(s)/gene(s). For each factor additional information is provided such as the cell type from which the factor data was taken, a brief description and statistical information. The table can be searched, and sorted on any column.
- 2. Raw data file The results can also be downloaded using the download button at the bottom of the page.
- 3. Bargraph of enrichment scores For larger queries (>20 genes/regions), enrichment scores are calculated and displayed in bargraph format.
- 4. Clustered Heatmap For queries of two or more regions, a downstream heirarchical clustering analysis is performed and displayed as a heatmap in PDF format where dark green in cell (i,j) represents the overlap of a peak in the factor 'j' dataset with the query regions 'i':
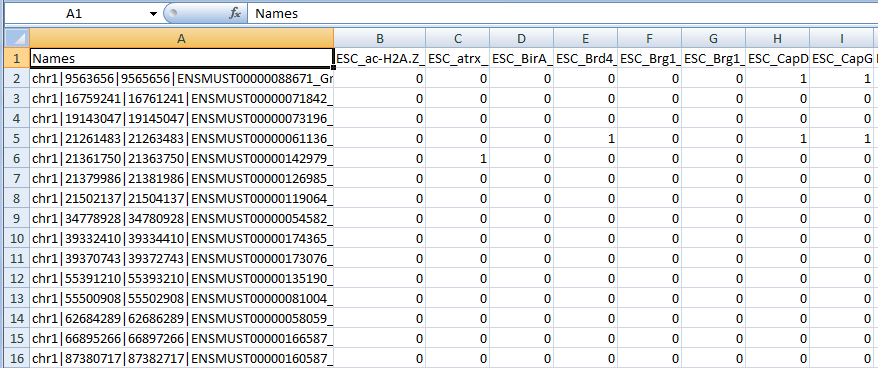
 The outputs from the tool include a comma-separated-vector (csv, excel compatible) formatted raw results file, in the form of a binary matrix, where row (i,j) contains the value of '1' if factor 'j' binds queried region 'i' and 0 if not.
The file will look like this:
Enrichment scores are calculated as follows: Let MX be the percentage of genes/regions in the query that are bound by factor X, and NX be the percentage of all genes/regions in the selected background bound the same factor, than the enrichment score, EX = log2 (MX / NX). The background is as defined by the user in the query page.
Click on the bargraph to open it in a new tab and zoom in and out.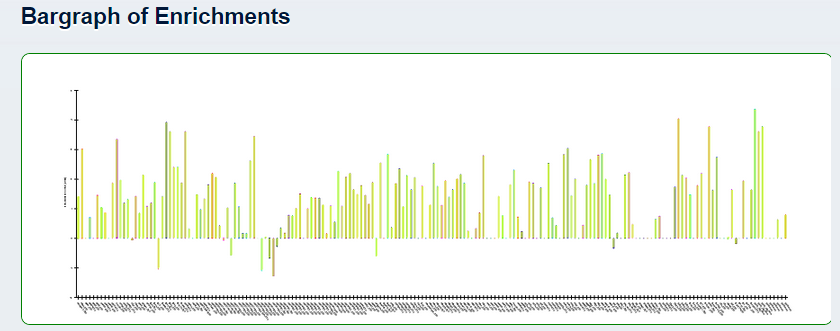
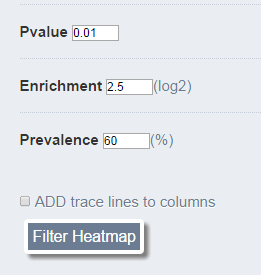
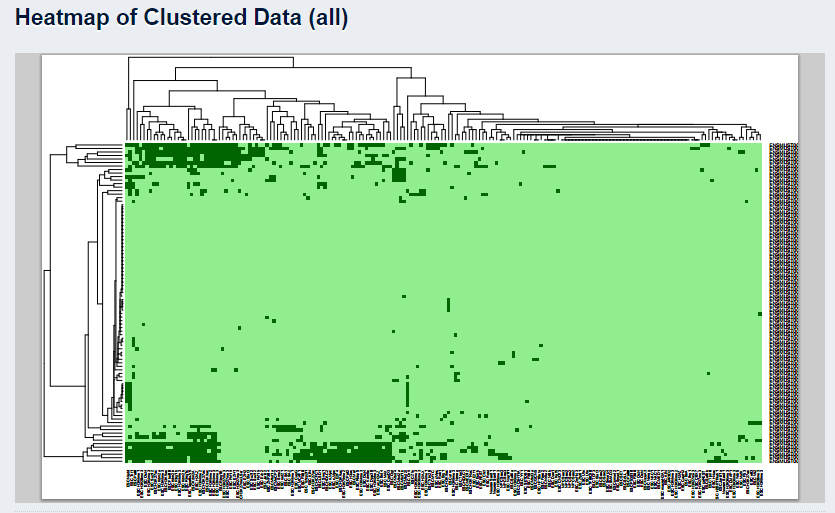 The factors can then be filtered according to enrichment score levels, statistical significance and prevalence to generate new clustered profiles and heatmaps, enabling the user to focus on certain epigenetic aspects of the queried regions.